What Is Debugging?
- Wikipedia: "debugging is the process of finding and resolving bugs (defects or problems that prevent correct operation) within computer programs, software, or systems.
Why is it broken, and how do we fix it?
Why Is Debugging Important?
- Programming isn't just writing code
- Planning / design
- Communication
- Review
- And figuring out why something isn't working
Developers spend significant time debugging and fixing code...
and yet many devs are uncomfortable or not confident doing this!
- Why don't developers know how to debug?
- Doesn't seem to be taught in schools - 学校没教
- Mostly comes from experience - 主要来自于经验
- Typically learned "the hard way" as you go - 通常是边走边学的 "硬道理"
Debugging is a critical skill for devs...and you can learn how to get better at it!
Core Principles of Debugging - 调试的核心原则
Every problem has a cause, and it should be possible to figure out why things are broken - 每一个问题都有一个原因,应该可以找出事情坏掉的原因
- Not necessarily easy to do this :) - 要做到这一点不一定容易
- Potential problems: non-deterministic behavior, hard to reproduce, difficult environment - 潜在的问题:非决定性的行为,难以复制,困难的环境
It's critical to understand the system's intended behavior and what should be happening - 了解系统的预期行为和应该发生的事情是至关重要的
- A bug is "the system not working as expected" - bug就是"系统没有按照预期工作"
- Have to know how it should behave to identify what's different and incorrect! - 必须知道它应该如何表现,以确定什么是不同的和不正确的!
Reproducing the issue is key! - 重现这个问题是关键!
- Helps confirm where the problem is happening - 有助��于确认问题发生的位置
- Allows further investigation of the actual behavior - 允许对实际行为进行进一步调查
- Lets you repeat the process to verify a fix actually does resolve the problem - 让你重复这个过程,以验证一个修复方案确实解决了问题
Debug with a plan - 有计划地进行调试
- Scientific method: form a hypothesis, experiment, check results - 科学方法:形成假设、实验、检查结果
- Be intentional about what changes you make - 对你所做的改变要有意向性
- Only change one piece of behavior at a time! - 每次只改变一项行为!这是最重要的!
- Critical to help determine if a change helped or hurt - 确定某个变化到底是好还是坏 是很关键的
- Narrow down possible causes - 缩小可能的原因
Errors provide useful information - 错误提供了有用的信息
- Error messages and stack traces are almost always helpful - 错误信息和堆栈跟踪几乎总是有帮助的
- Where did the error occur? - 错误发生在哪里?
- What was the first cause? - 第一个原因是什么?
- When did this happen? - 这是什么时候发生的?
- Identify the most relevant piece of the error and search for that - 确定最相关的错误部分并进行搜索
- "How to Google Your Errors" has good tips - "如何谷歌你的错误 "有很好的提示
"Everyone knows that debugging is twice as hard as writing a program in the first place. So if you're as clever as you can be when you write it, how will you ever debug it?" - 每个人都知道, 调试的难度是最初编写程序的两倍。因此,如果你在写的时候就已经很聪明了,你怎么会去调试它呢?
- Brian Kernighan
- Reading and understanding what code does is always important, but especially with debugging - 阅读和理解代码的作用总是很重要的,但特别是在调试方面
- Write code with clarity as a primary goal! - 写代码时要以清晰为首要目标!
General Debugging Steps - 通用调试步骤
- Understand the problem description - 理解问题描述
- Reproduce the issue - 重现该问题
- Narrow down the reproduction to the smallest example that causes the bug - 将繁殖范围缩小到导致该错误的最小的例子
- Determine why the problem is happening - 确定问题发生的原因
- Form hypothesis, test, experiment - 形成假设、测试、实验
- Narrow down possibilities - 缩小可能性
- Trace to a root cause if possible - 如果可能的话,追踪到根本原因
- Determine the best approach for fixing - 确定修复的最佳方法
- Try to fix the root cause, not the symptoms - 尝试解决根本原因,而不是症状
- Understand constraints (severity, code requirements) - 了解制约因素(严重程度,代码要求)
- Fix the issue - 修复问题
- Actually implement changes to fix behavior - 实际执行改变以修复行为
- Add checks to ensure this entire type of problem can't happen again (tests, error handling) - 增加检查以确保这整个类型的问题不会再发生(测试、错误处理)。
- Document as much as possible - 尽可能多地记录
Tips for Debugging
- Use the right tool for the job - 使用正确的工具来完成工作
- Many tools available to help understand what's happening in a system, each with different tradeoffs - use whatever you need for this problem! - 有许多工具可以帮助理解系统中发生的事情,每个工具都有不同的权衡--使用你需要的任何工具来解决这个问题!
- The more tools you have in your toolbox, the more likely you'll know what the best tool is for a situation - 你的工具箱中的工具越多,你就越有可能知道在某种情况下什么是最好的工具
- Dig into abstractions and look at underlying implementations - 深入研究抽象概念并查看底层实现
- Often need to look at lower levels of code to understand behavior - 通常需要查看较低层次的代码来理解行为
- This includes third-party libraries! - 这包括第三方库!
- Be willing to dig into unfamiliar source code, including libraries that you don't "own", in order to understand what's going on beneath the surface - 愿意挖掘不熟悉的源代码,包括你不 "拥有 "的库,以了解表面下发生的事情。
- Don't be afraid! - 不要害怕
- Easy to be "scared" of an issue due to lack of experience or apparent system complexity - 由于缺乏经验或明显的系统复杂性,很容易对一个问题感到 "害怕"。
- Break down the problem into smaller pieces - 将问题分解成小块
- You can figure this out! - 你可以解决它!
- Know when to keep going, and when to stop - 知道什么时候该继续前进,什么时候该停下来(坚持、专注、适时休息)
- Persistence and focus are important - 坚持和专注是很重要的
- Takes time to build up mental context about what's happening ("flow state") - 需要时间来建立关于正在发生的事情的心理背景("流动状态")。
- We're human and need time to rest - it's often good take a break and come back later! - 我们是人,需要时间来休息--经常休息一下,以后再来!。
- Resting gives us a chance to recover, and often the brain can figure things out in the background - 休息给了我们一个恢复的机会,而且往往大脑可以在后台把事情弄清楚
Debugging Techniques and Tools
Debugging Tools
Should I Use a Graphical Debugger, or Print Logging? - 我应该使用图形调试器,还是打印记录?
Print Logging vs Graphical Debuggers
- Print logging - 打印记录
- Easy to add - 容易添加
- Can show changes over time - 可以显示出随时间的变化
- Always available in every environment, even remote servers - 在每一个环境中始终可用,甚至是远程服务器
- Helpful to have logging with multiple levels built into the code that can be enabled without having to rebuild the app - 有利于在代码中内置多级日志,无需重建应用程序即可启用。
- GUI debuggers - GUI�调试器
- Can help drill down on specific behavior - 可以帮助深入了解具体的行为
- Really helpful to see individual variables change step-by-step - 看到个别变量的逐步变化,真的很有帮助
- Let you inspect the call stack, look at memory, use additional visualizers - 让你检查调用堆栈,查看内存,使用额外的可视化工具
- Great if you're working with an app that can be debugged with a GUI, but many environments can't be - 如果你正在处理一个可以用GUI调试的应用程序,那就很好,但许多环境不能用GUI调试。
Print Logging Techniques
- Be familiar with the different logging methods and tools in your app's environment - 熟悉你的应用程序环境中的不同记录方法和工具
- Timestamps are useful for tracing execution timing - 时间戳对于追踪执行时间非常有用
- Helpful to have multiple levels of logging that can be turned on and off - 有利于拥有可开启和关闭的多级日志记录
- Typical levels:
trace,debug,info,warn,error- 典型级别 - Formatting log output can sometimes be expensive - log libraries often have an option to check if a given log level is enabled - 日志输出的格式化有时会很昂贵--日志库通常有一个选项,可以检查是否启用了某个特定的日志级别
- Typical levels:
JS Specific Debugging Techniques
consolefamily of methods - console家族- Levels:
log(),debug(),info(),warn(),error()- 日志级别 - Formatted display:
group(),table()- 格式化显示 - Execution flow:
count(),time(),timeStamp()- 执行流程 - Error/checks:
trace(),assert()- 错误/检查
- Levels:
- Tips for logging:
console.log()and family accept many args, either strings or values:console.log('Item 1: ', val1, 'item 2: ', val2)- Logged objects/arrays will be interactive and expandable in the DevTools Console - 记录的对象/数组将是交互式的,并可在DevTools控制台中展开。
- Simplify logging with object shorthand:
console.log({val1, val2})- 用对象速记法简化日志记录
- Reminder: the DevTools Console shows expanded object/array values as they are now, not as they were when logged! - 提醒一下: DevTools控制台显示的是扩展的对象/数组值,是现在的样子,而不是记录时的样子!。
- You can edit library source files in
node_modules! - 你可以编辑node_modules中的库源文件- JS libs normally distributed as actual JS files on disk - JS库通常作为实际的JS文件在磁盘上发布
- Edit
node_modules/some-lib/some-file.js, add some logging, reload - 编辑node_modules/some-lib/some-file.js,添加一些日志,重新加载 - Don't forget to undo edits after you're done :) - 完成后别忘了撤销编辑
Using a GUI Debugger: Terms and Concepts - 使用GUI调试器: 术语和概念
Most GUI debuggers share common concepts and controls: - 大多数GUI调试器有共同的概念和控制:
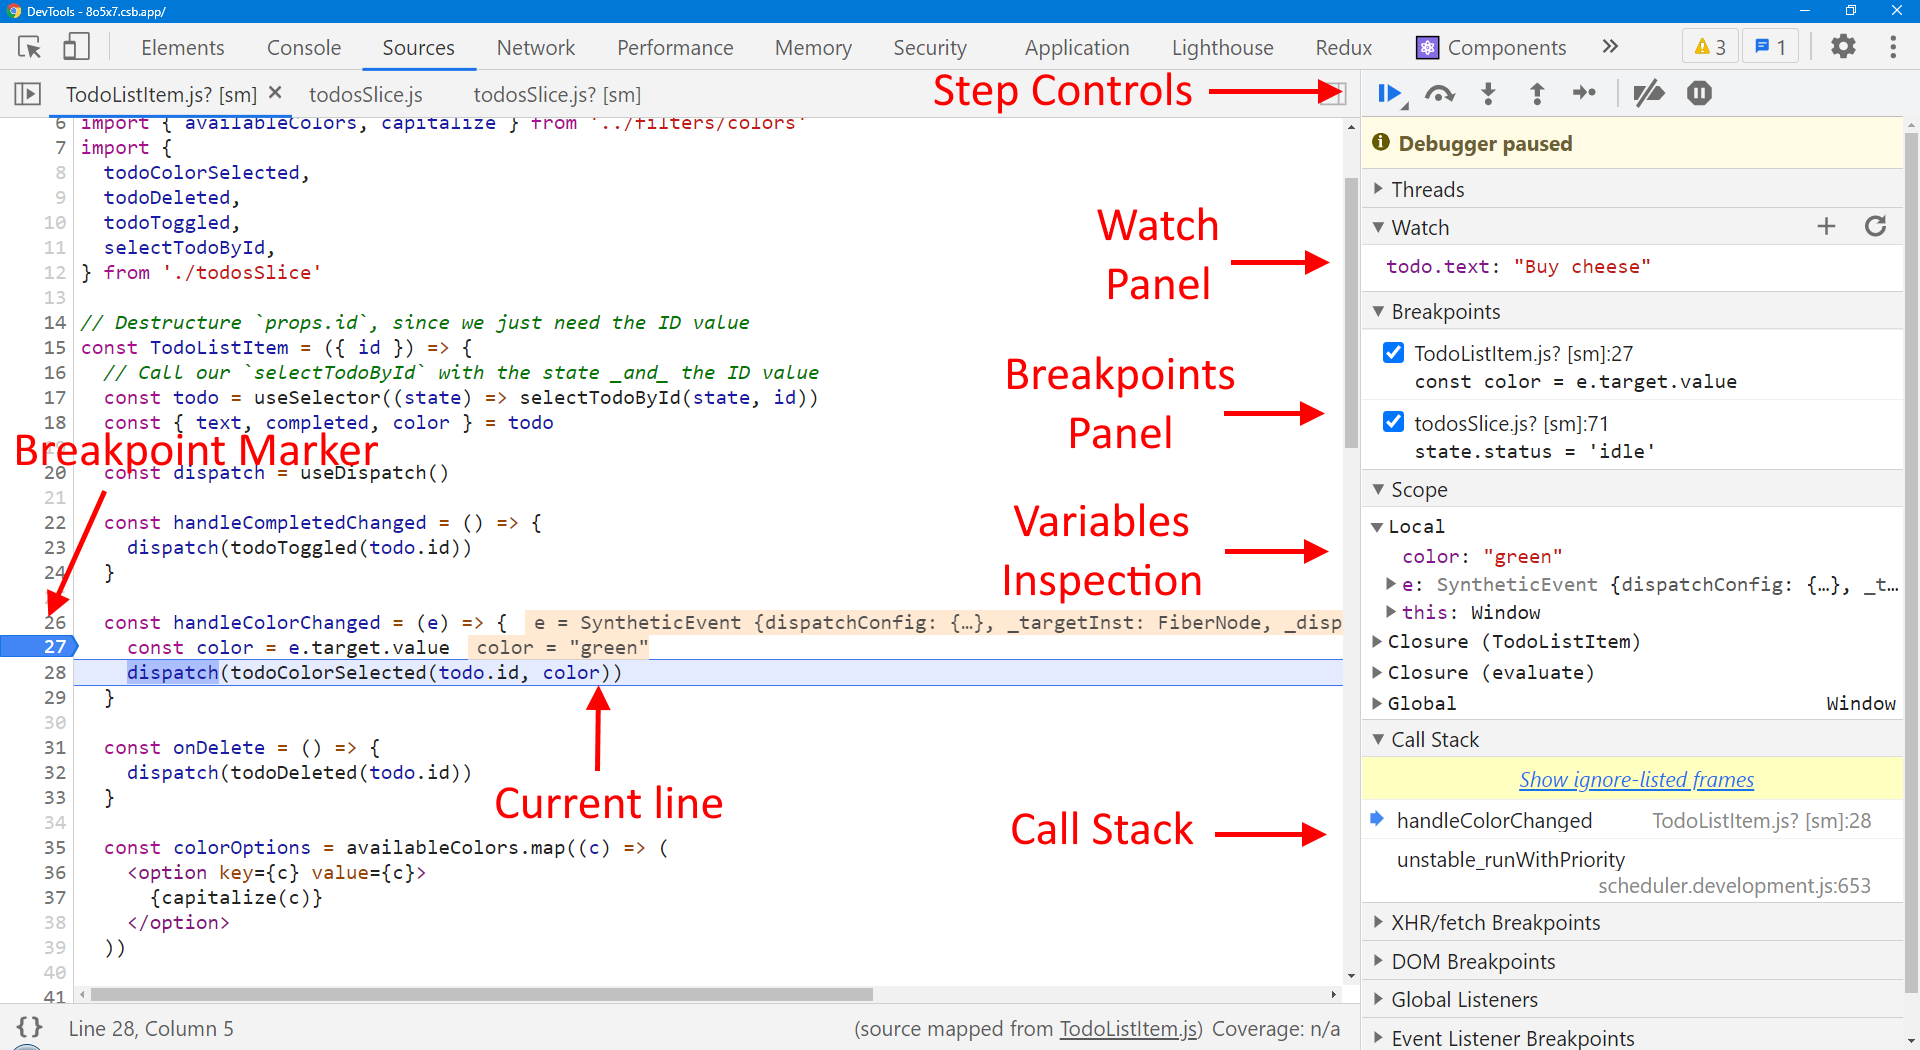
- Breakpoints: marking a specific line of code to tell the debugger to stop when execution reaches that line - 断点:标记一个特定的代码行,告诉调试器在执行到该行时停止
- Typically set by left-clicking a line number - 通常通过左键点击行号来设置
- Panel shows list of all defined breakpoints - 面板上会显示所有定义的断点列表
- Can be disabled by right-clicking line number marker, or unchecking checkbox in panel - 可以通过右键单击行号标记,或取消面板中的复选框来禁用。
- Can be made conditional ("only stop if this condition is true", with arbitrary code snippet for comparison) - 可以做成条件("只有在这个条件为真时才停止",用任意的代码片断进行比较)。
- Some tools support watchpoints: log a value instead of stopping execution - 一些工具支持观察点:记录一个值而不是停止执行
- Variable inspection: view the values of variables - 可变的检查: 查看变量的值
- "Variables/Scope" panel: view variables in scope - "变量/范围 " 面板:查看范围内的变量
- Watches panel: evaluate arbitrary value lookups (
obj.nested.field) - 监听 面板:评估任意值查询(obj.nested.field)。
- Call stack: current nested functions in progress - 调用栈:程序最近调用的方法
- Step controls: advance execution, then pause - 步骤控制:提前执行,然后暂停
- Step into: run next line; if a function, stop inside
- Step over: run next line; if a function, go past it
- Step out: run to end of current function, pause above
- Pause: interrupt running code
Debugger Controls - Chrome DevTools
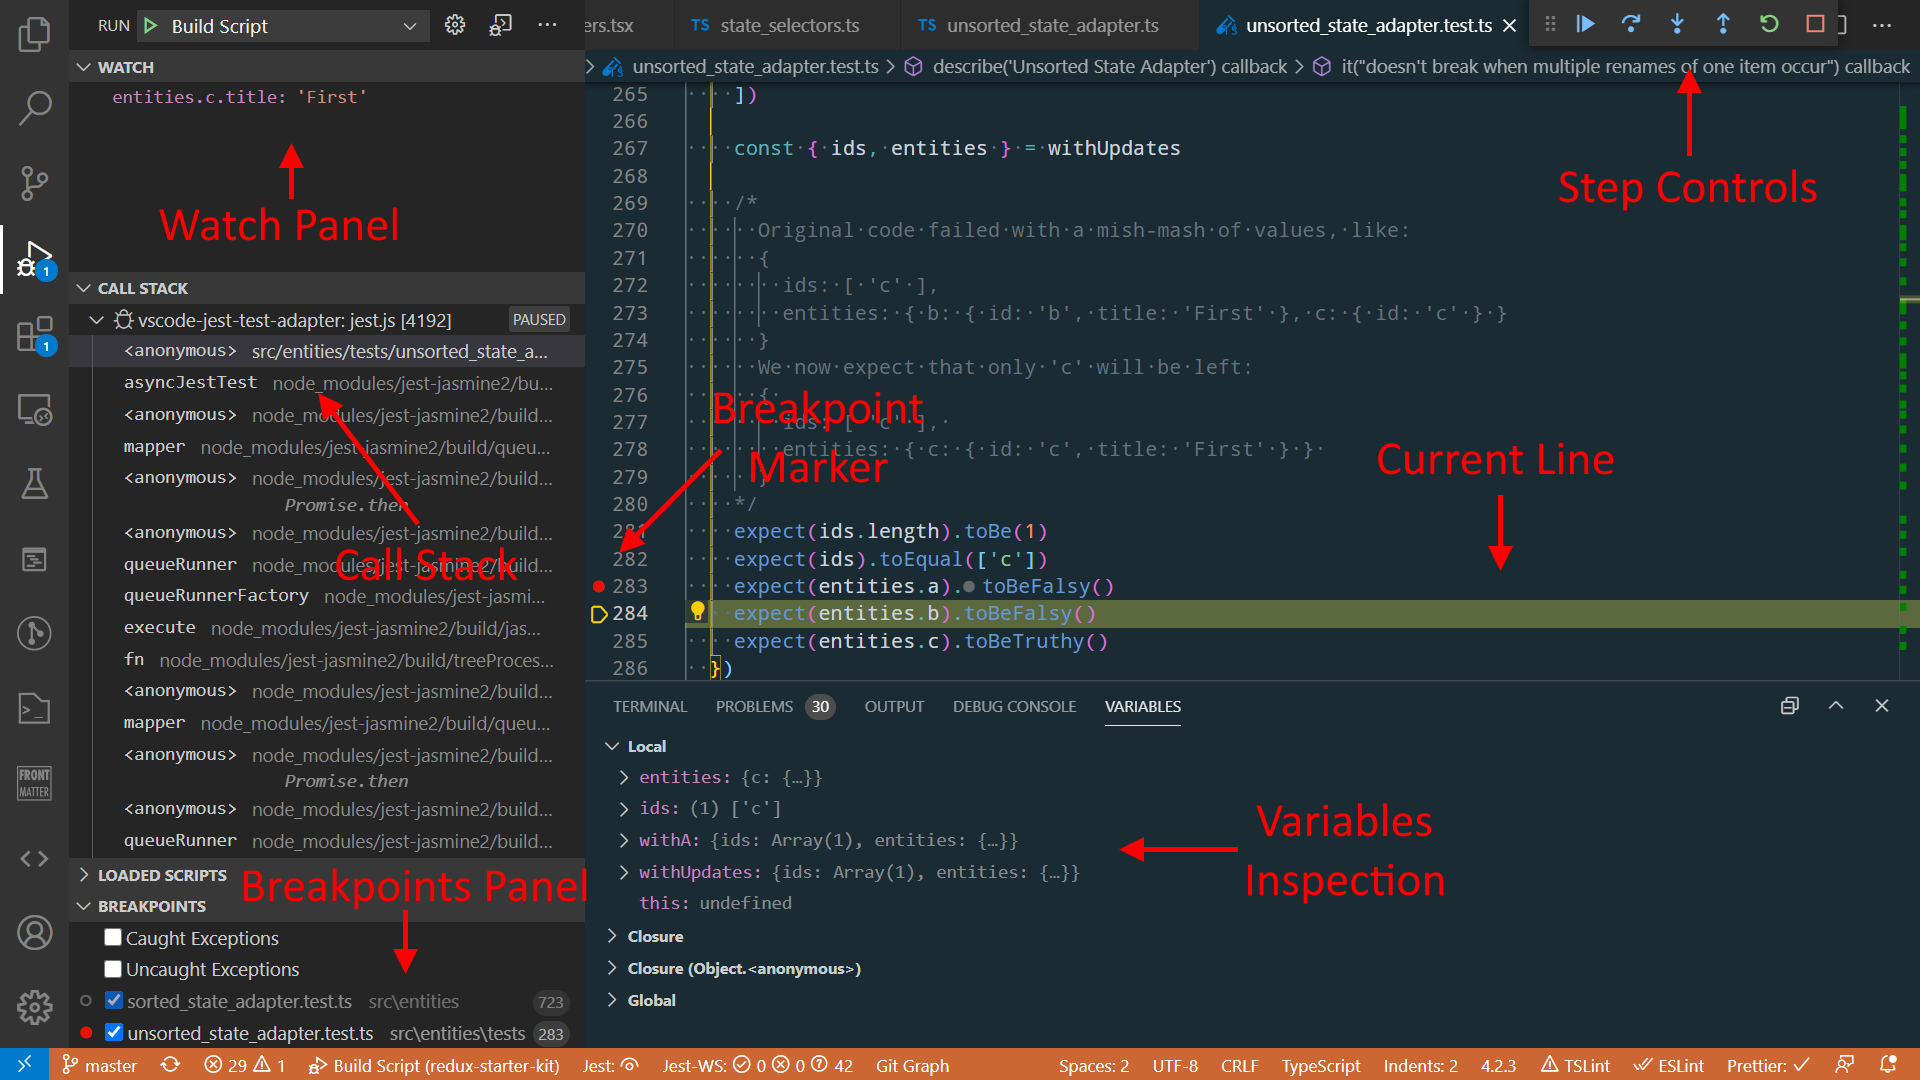
Debugger Controls - VS Code
Debugging React
- Key: Understand React's component model and data flow! - 理解react的组件模型和数据流
- Mark Erikson: A (Mostly) Complete Guide to React Rendering Behavior
- Dan Abramov: A Complete Guide to
useEffect
- Component model:
- UI is based on state + props - UI是基于state+props的
- Re-renders and UI updates are based on state updates - state变化会引起重新渲染和UI升级
- If UI is wrong, either render logic is incorrect, or data is wrong - 如果用户界面是错误的,要么是渲染逻辑不正确,要么是数据有问题
- Data flow:
- Data flows down the tree from parents to children - 数据在树上从父母流向子女
- Check data source: state, props, context, external state management - 检查数据源:状态、props、上下文、外部状态管理
- For props, trace flow back up through parents in the component tree - 可以通过组件树中的父辈来追溯流向的props
- Remember: state updates are 'async', renders are batched, and closures can point to stale data! - state更新是异步的,render是批量的,闭包可以指向陈旧的数据!
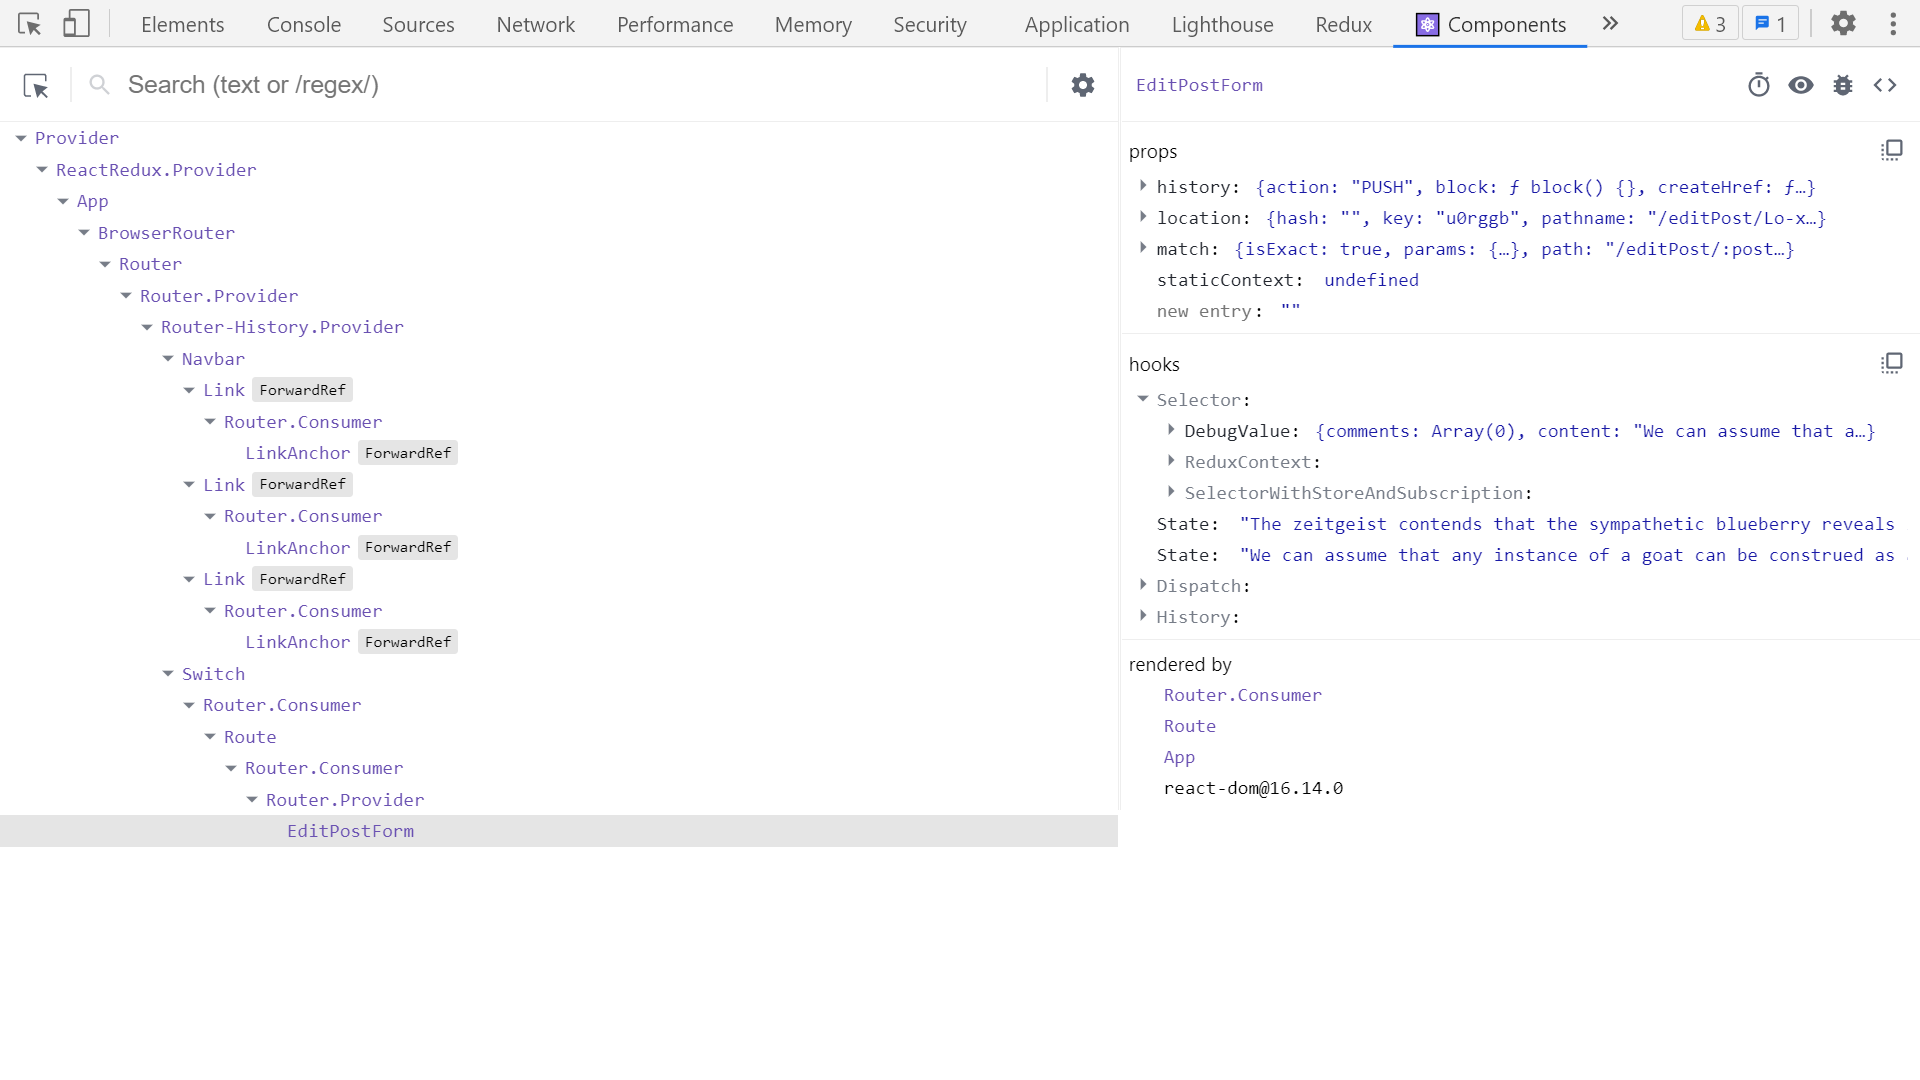
- Use the React DevTools!
- Select a DOM node in the "Elements/Inspector" tab, switch to "Components" tab - React component that rendered that DOM element will be selected too - 在 "Elements/Inspector "标签中选择一个DOM节点,切换到 "Components "标签--渲染该DOM元素的React组件也将被选中。
- Use component name search and component type filters to narrow down what components are shown - 使用组件名称搜索和组件类型过滤器来缩小所显示的组件范围
- Use "Rendered By" panel to trace parent components and data - 使用 "Rendered By "面板来追踪父级组件和数据
React DevTools
Debugging Redux
- Key: Understand Redux's requirements and data flow! - 理解redux的要求和数据流很关键
- Redux docs: Redux Fundamentals, Part 2: Redux Concepts and Data Flow
- Mark Erikson: The Tao of Redux, Part 1: Implementation and Intent
- Requirements:
- All state update logic is in the reducer functions - 所有的状态更新逻辑都在reducer函数中
- All updates are done immutably - 所有的更新都是不可改变的
- Data flow:
- All state updates are triggered by dispatching an action - 所有的状态更新都是通过调度一个动作来触发的
- The store runs the reducer logic with
(state, action)and saves the new state - 存储器用(state, action)运行 reducer 逻辑,并保存新的状态 - UI reads latest state and re-renders if extracted data has changed (by reference) - UI读取最新的状态,如果�提取的数据有变化,则重新显示
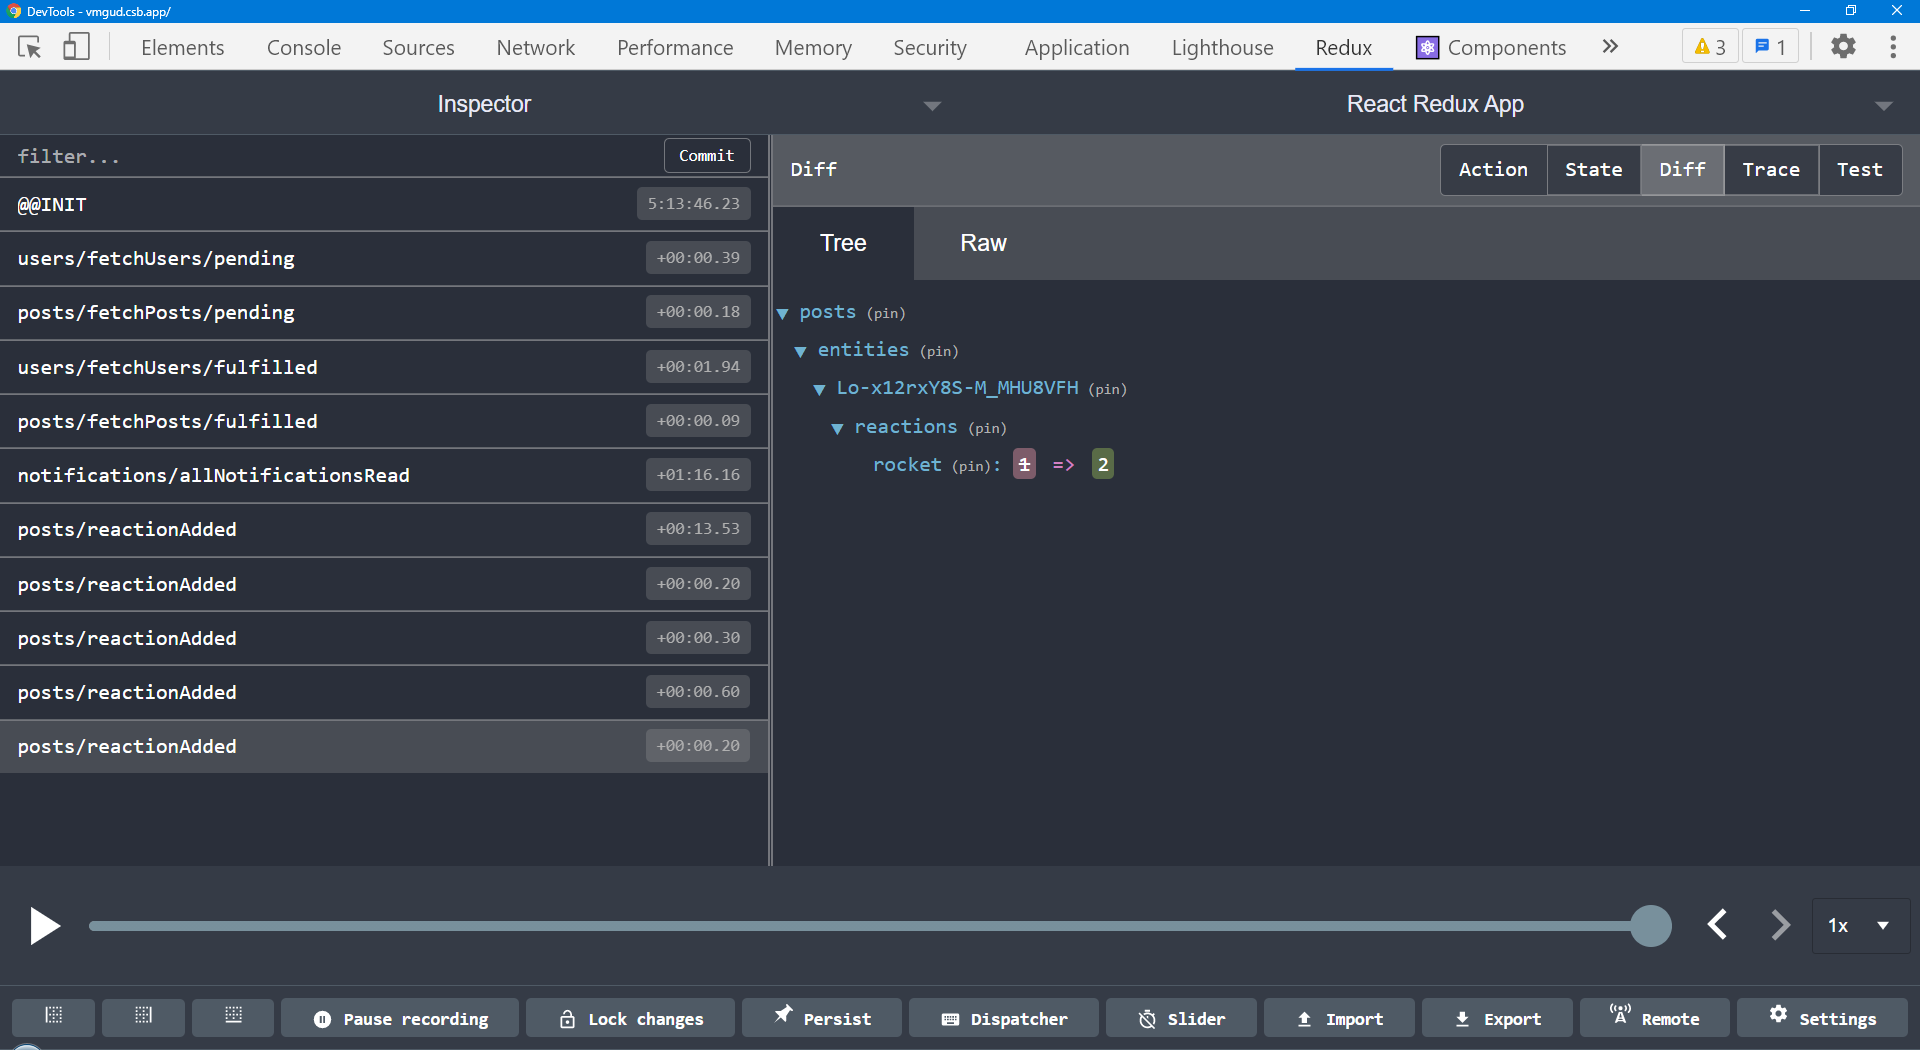
- Use the Redux DevTools!
- Actions list shows name of each dispatched action (
'todos/todoAdded') - 行动列表显示每个被派遣行动的名称 - Selecting an action shows the action contents, state diff, and result state - 选择一个动作会显示动作内容、状态差异和结果状态
- Use the "Trace" tab to view the stack trace where the action was dispatched - 使用 "跟踪 "选项卡查看动作被分派的堆栈跟踪。
- Can "time travel debug" by undoing / skipping actions - 可以通过撤销/跳过动作进行 "时间旅行调试"
- Actions list shows name of each dispatched action (
- Use Redux Toolkit!
- Eliminates accidental mutations, the #1 most common Redux bug - 消除了意外突变,这是Redux最常见的第一大错误
- Drastically simplifies Redux logic - 大大简化了Redux的逻辑
Redux DevTools
原文档: https://blog.isquaredsoftware.com/presentations/2023-06-debugging-js/?slideIndex=0&stepIndex=0